ETFGI Reports That Assets Invested In The Actively Managed ETFs Listed Globally Reached A New Record Of US$1.48 Trillion At The End Of June
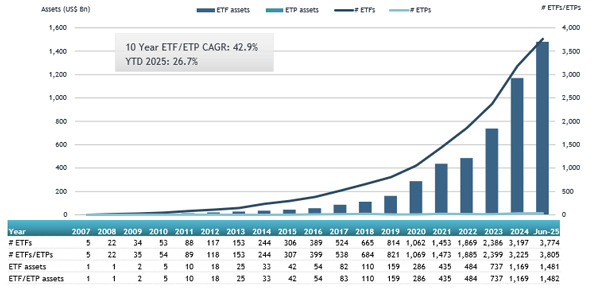
ETFGI, a leading independent research and consultancy firm renowned for its expertise in subscription research, consulting services, events, and ETF TV on global ETF industry trends, reported today that assets invested in the actively managed ETFs industry globally reached a new record of US$1.48 trillion at the end of June. During June the actively managed ETFs industry globally gathered net inflows of US$46.77 billion, bringing year-to-date net inflows to a record US$267.02 billion, according to ETFGI's June 2025 Active ETF and ETP industry landscape insights report, an annual paid-for research subscription service. (All dollar values in USD unless otherwise noted.)
Global Actively Managed ETF Industry Update – June 2025
- Record-High Assets: Assets invested in the global actively managed ETFs industry reached a new all-time high of $1.48 trillion at the end of June 2025, surpassing the previous record of $1.39 trillion set in May 2025.
- Strong Year-to-Date Growth: Assets have grown by 26.7% year-to-date, rising from $1.17 trillion at the end of 2024 to $1.48 trillion by June 2025.
- Robust Monthly Inflows: The industry recorded $46.77 billion in net inflows during June 2025.
- Record-Breaking YTD Inflows: Year-to-date net inflows stand at $267.02 billion, the highest on record. This surpasses the previous YTD records of $153.46 billion in 2024 and $80.03 billion in 2021.
- Sustained Momentum: June marked the 63rd consecutive month of net inflows into actively managed ETFs.
The S&P 500 rose 5.09% in June, bringing its H1 2025 gain to 6.20%. Developed Markets (ex-US) increased 3.24% in June, and are up a strong 20.29% year-to-date. Top Performers in June: Korea: +16.12% and Israel: +11.60%. Emerging Markets gained 4.80% in June, with a year-to-date increase of 11.41%. Top Performers in June: Taiwan: +8.53% and Turkey: +8.49%, according to Deborah Fuhr, managing partner, founder, and owner of ETFGI.
Growth in assets in the actively managed ETFs listed globally as of end of June


There were 3,805 actively managed ETFs listed globally, with 4,942 listings assets of $1.48 Tn, from 573 providers listed on 42 exchanges in 33 countries at the end of June.
Equity focused actively managed ETFs listed globally gathered net inflows of $24.65 Bn during June, bringing year to date net inflows to $148.98 Bn, higher than the $89.35 Bn in net inflows YTD in 2024. Fixed Income focused actively managed ETFs listed globally reported net inflows of $20.51 Bn during June, bringing YTD net inflows to $102.60 Bn, much higher than the $54.49 Bn in net inflows YTD in 2024.
Substantial inflows can be attributed to the top 20 active ETFs by net new assets, which collectively gathered
$19.70 Bn during June. JPMorgan Mortgage-Backed Securities ETF (JMTG US) gathered $5.78 Bn, the largest individual net inflow.
Top 20 actively managed ETFs by net new assets June 2025
|
Name |
Ticker |
Assets |
NNA |
NNA |
|
JPMorgan Mortgage-Backed Securities ETF |
JMTG US |
5,782.13 |
5,782.13 |
5,782.13 |
|
JPMorgan Active High Yield ETF |
JPHY US |
2,007.72 |
1,999.79 |
1,999.79 |
|
Direxion Daily TSLA Bull 2X Shares |
TSLL US |
6,170.93 |
3,971.67 |
1,059.36 |
|
YieldMax MSTR Option Income Strategy ETF |
MSTY US |
5,146.91 |
4,034.69 |
897.18 |
|
JPMorgan Nasdaq Equity Premium Income ETF |
JEPQ US |
28,053.12 |
7,852.70 |
877.55 |
|
Janus Henderson AAA CLO ETF |
JAAA US |
21,805.72 |
5,194.61 |
876.46 |
|
Capital Group Dividend Value ETF |
CGDV US |
18,604.79 |
4,524.17 |
835.90 |
|
iShares U.S. Equity Factor Rotation Active ETF |
DYNF US |
19,154.11 |
4,379.90 |
784.40 |
|
Neos Nasdaq-100 High Income ETF |
QQQI US |
2,605.42 |
1,818.96 |
779.40 |
|
JPMorgan Ultra-Short Income ETF |
JPST US |
31,897.10 |
3,665.51 |
751.97 |
|
KB RISE Short Term Specialized Bank Bond Active ETF |
0061Z0 KS |
674.53 |
674.53 |
674.53 |
|
MIRAE ASSET TIGER MONEY MARKET ACTIVE ETF |
0043B0 KS |
908.37 |
1,026.10 |
588.66 |
|
JPMorgan Limited Duration Bond ETF |
JPLD US |
1,769.05 |
798.74 |
556.72 |
|
JPMorgan Equity Premium Income ETF |
JEPI US |
40,993.10 |
4,508.56 |
549.50 |
|
Tortoise Energy Fund |
TNGY US |
536.61 |
533.81 |
533.81 |
|
Brown Advisory Sustainable Growth ETF |
BASG US |
489.29 |
473.72 |
473.72 |
|
Capital Group Growth ETF |
CGGR US |
13,512.71 |
3,106.54 |
470.61 |
|
Fidelity Total Bond ETF |
FBND US |
19,269.55 |
2,012.63 |
426.56 |
|
Blackrock Flexible Income ETF |
BINC US |
9,839.83 |
2,829.76 |
394.94 |
|
TCW Core Plus Bond ETF |
FIXT US |
389.41 |
383.69 |
383.69 |

Investors have tended to invest in Equity actively managed ETFs during June.
