ETFGI Reports Assets Invested In ETFs And ETPs Listed In Canada Reached US$ 171.62 Billion A New Record At The End Of July 2020
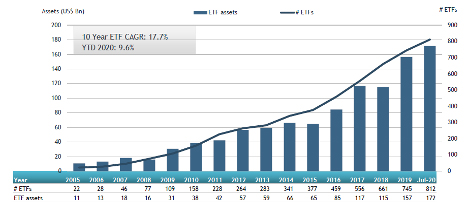
ETFGI, a leading independent research and consultancy firm covering trends in the global ETFs/ETPs ecosystem, reported today that assets invested in ETFs and ETPs listed in Canada reached US$ 171.62 billion a new record at the end of July. ETFs and ETPs listed in Canada gathered net inflows of US$4.58 billion during June, bringing year-to-date net inflows to US$21.40 billion which is significantly more than US$9.00 billion in net inflows gathered at this point in 2019 and nearly as much as the US$20.93 billion gathered in all of 2019. At the end of the month, Canadian ETF assets increased by 7.5%, from US$159.58 billion at the end of June to US$171.62 billion according to ETFGI's July 2020 Canadian ETF and ETP industry landscape insights report, a monthly report which is part of an annual paid-for research subscription service. (All dollar values in USD unless otherwise noted.)
Highlights:
- Assets invested in ETFs/ETPs listed in Canada reached a new record of $171.62 BN at the end of July.
- ETFs and ETPs listed in Canada gathered net inflows of $4.58 Bn during July the second highest monthly net inflow on record. February 2020 was the largest monthly net inflow with $6.28 Bn.
- YTD net inflows are $21.40 Bn which is significantly more than $9.00 Bn in net inflows gathered at this point in 2019 and nearly as much as the $20.93 Bn gathered in all of 2019.
“The S&P 500 gained 5.6% in July, aided by the U.S. Federal Reserve stimulus and strong earnings. International markets also gained, with Developed Ex-U.S. and Emerging up 3.0% and 8.5%, respectively. In the developed markets Scandinavian countries benefited most, led by Norway (up 10.8%) and Sweden (up 10.1%); while Japan (down 2.0%) was the sole negative performer among developed countries. Dollar weakness contributed toward the positive momentum in Emerging markets where 19 of 25 countries gained, led by Brazil (up 14.4%) and Pakistan (up 13.4%), while Taiwan (up 12.1%) neared an all-time high.” According to Deborah Fuhr, managing partner, founder and owner of ETFGI.
At the end of July 2020, the Canadian ETF industry had 812 ETFs, with 984 listings, assets of US$172 Bn, from 36 providers listed on 2 exchanges.
Growth in Canadian ETF and ETP assets as of the end of July 2020

ETFs and ETPs listed in Canada gathered net inflows of $4.58 Bn in July. Year to date, net inflows stand at $21.40 Bn. At this point last year there were net inflows of $9.00 Bn. Equity ETFs/ETPs gathered net inflows of $1.37 Bn over July, bringing net inflows for the year to $10.93 Bn, much higher than the $1.01 Bn in net inflows Equity products had attracted for the year to July 2019. Active ETFs/ETPs attracted net inflows of $2.18 Bn over the month, gathering net inflows YTD of $6.89 Bn, greater than the $4.98 Bn in net inflows Active products had reported for the year to July 2019. Fixed Income ETFs/ETPs had net inflows of $889 Mn during July, bringing net inflows for the year to July 2020 to $2.79 Bn, slightly higher than the $2.77 Bn in net inflows Fixed Income products had attracted by the end of July 2019. Commodity ETFs/ETPs accumulated net inflows of $85 Mn in July. Year to date, net inflows are at $406 Mn, compared to net inflows of $44 Mn over the same period last year.
Substantial inflows can be attributed to the top 20 ETFs by net new assets, which collectively gathered $3.74 Bn during July. NBI Unconstrained Fixed Income ETF (NUBF CN) gathered $1.21 Bn alone.
Top 20 ETFs by net new assets July 2020: Canada
|
Name |
Ticker |
Assets |
NNA |
NNA |
|
NUBF CN |
1,215.61 |
1,218.25 |
1,214.37 |
|
|
iShares S&P/TSX 60 Index Fund |
XIU CN |
6,834.40 |
450.45 |
441.40 |
|
iShares S&P 500 Index ETF |
XUS CN |
2,287.35 |
683.04 |
437.98 |
|
Manulife Multifactor Developed International Index ETF |
MINT/B CN |
294.20 |
166.17 |
167.82 |
|
BMO Aggregate Bond Index ETF |
ZAG CN |
3,825.15 |
(296.93) |
151.85 |
|
iShares Global Government Bond Index ETF Cad Hedged |
XGGB CN |
205.37 |
162.68 |
147.30 |
|
TD S&P/TSX Capped Composite Index ETF |
TTP CN |
500.19 |
185.25 |
139.88 |
|
Manulife Multifactor Emerging Markets Index Etf |
MEME/B CN |
215.00 |
138.02 |
138.02 |
|
CI First Asset Gold Giants Covered Call ETF |
CGXF CN |
343.86 |
217.47 |
120.97 |
|
TD Canadian Aggregate Bond Index ETF |
TDB CN |
460.97 |
234.26 |
90.99 |
|
High Interest Savings Account Fund |
HISA CN |
253.52 |
195.54 |
87.01 |
|
iShares Core Canadian Universe Bond Index ETF |
XBB CN |
3,567.16 |
409.47 |
82.55 |
|
Mackenzie Canadian Equity Index ETF |
QCN CN |
177.88 |
144.98 |
74.97 |
|
TD Global Technology Leaders Index ETF |
TEC CN |
177.07 |
129.35 |
70.52 |
|
BMO Mid Provincial Bond Index ETF |
ZMP CN |
537.23 |
63.09 |
67.97 |
|
BMO Ultra Short-Term Bond ETF |
ZST CN |
541.25 |
47.82 |
65.16 |
|
Horizons Cash Maximizer ETF - Acc |
HSAV CN |
361.49 |
355.86 |
65.03 |
|
iShares Gold Bullion Fund - CAD Hdg |
CGL CN |
694.75 |
245.85 |
63.22 |
|
BMO Laddered Preferred Share Index ETF |
ZPR CN |
1,468.12 |
36.14 |
61.12 |
|
CI High Interest Savings Fund |
CSAV CN |
1,864.32 |
782.22 |
55.51 |

Investors have tended to invest in Active ETFs during July.
