Bahamas International Securities Exchange January To June 2019 Statistical Report
BISX is pleased to announce its BISX All-Share Index and trading statistics for the six-month period ending June 28, 2019 with comparison to the same period of 2018.
BISX ALL SHARE INDEX
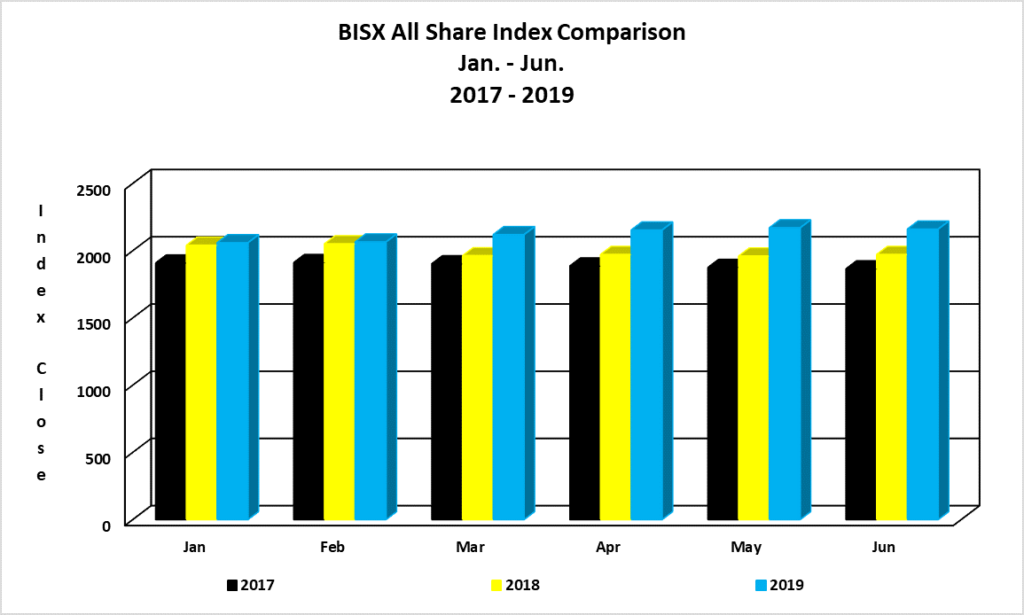
For the six-month period ending June 28, 2019 the BISX All-Share Index closed at 2,160.46. This represents a year to date increase of 50.51 or 2.42%. By comparison for the six-month period ending June 29, 2018 the BISX All-Share Index closed at 1,971.53. This represented a year to date decrease of 92.04 or -4.46%. The BISX All-Share Index is a market capitalization weighted index comprised of all primary market listings excluding debt securities.
As at June 28, 2019 the market was comprised of 19 ordinary shares with a market capitalization of $4.626 Billion. In addition, there were 13 preference shares with a market capitalization of $327.25 Million and 13 bonds with a face value of $513 Million.
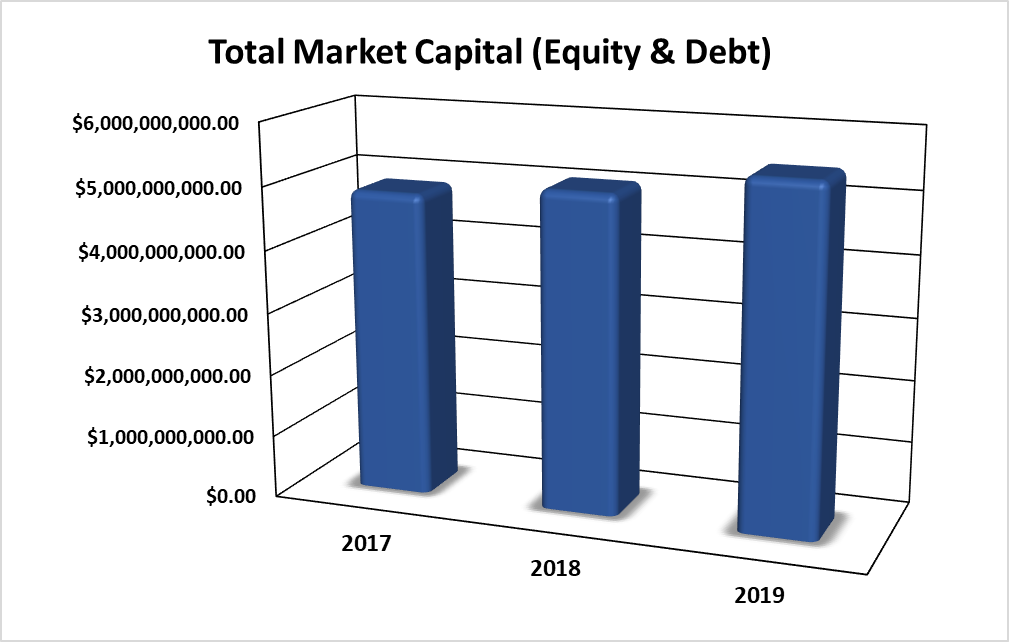
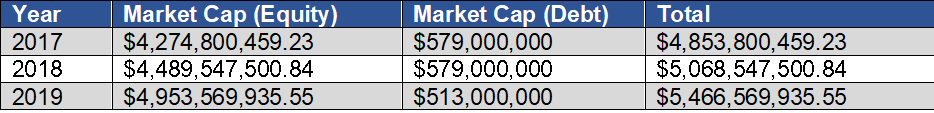
MARKET CAPITAL
Over the 3-year period 2017 to 2019, the market value of all securities listed on BISX has shown an increase, as indicated by the chart below:
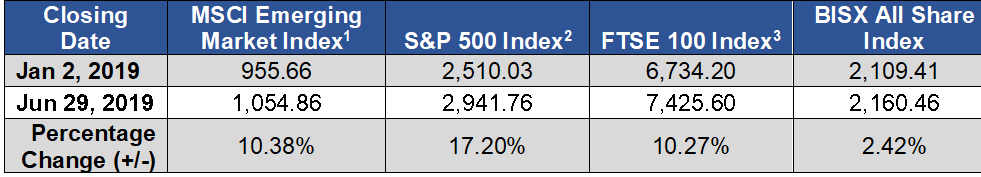
COMPARISON OF BISX ALL SHARE INDEX TO INTERNATIONAL INDICES
Over the 6-month period January 2 to June 28, 2019, some international equity markets have experienced increases as indicated by the chart below:
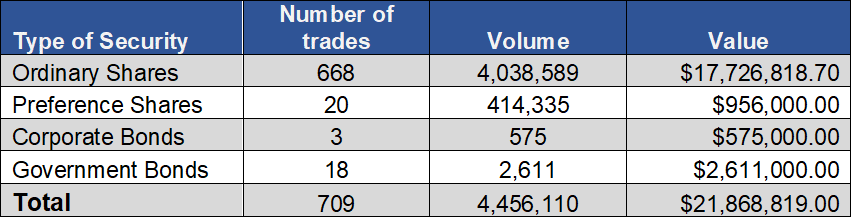
TOTAL TRADES BY SECURITY CLASS
For the six-month period ending June 28, 2019, each security class produced the totals in the chart below:
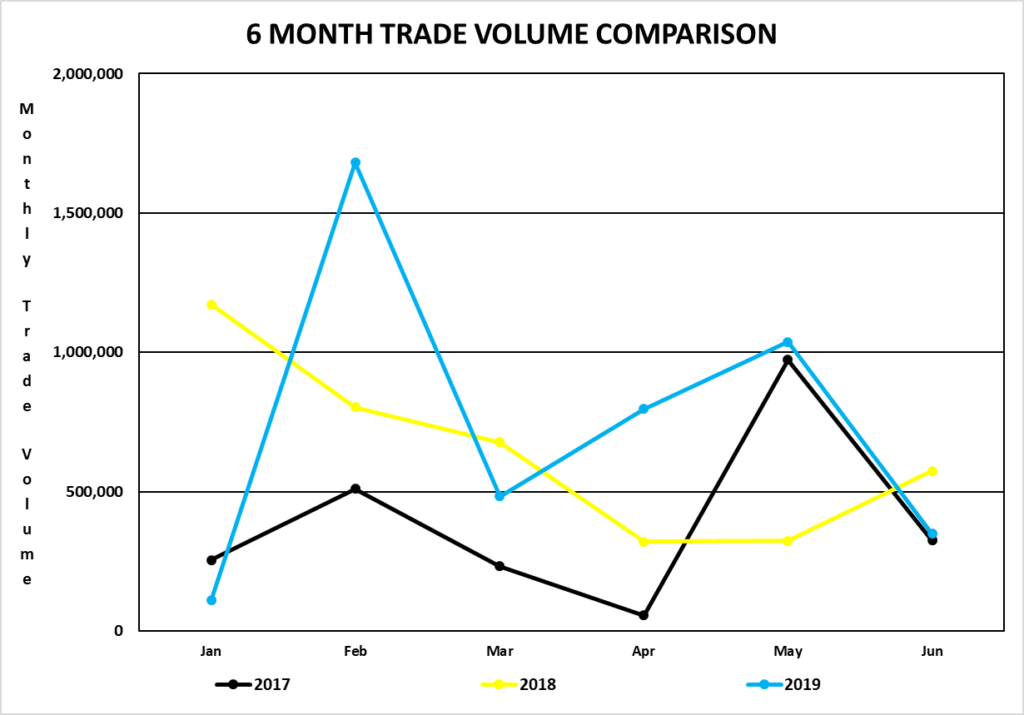
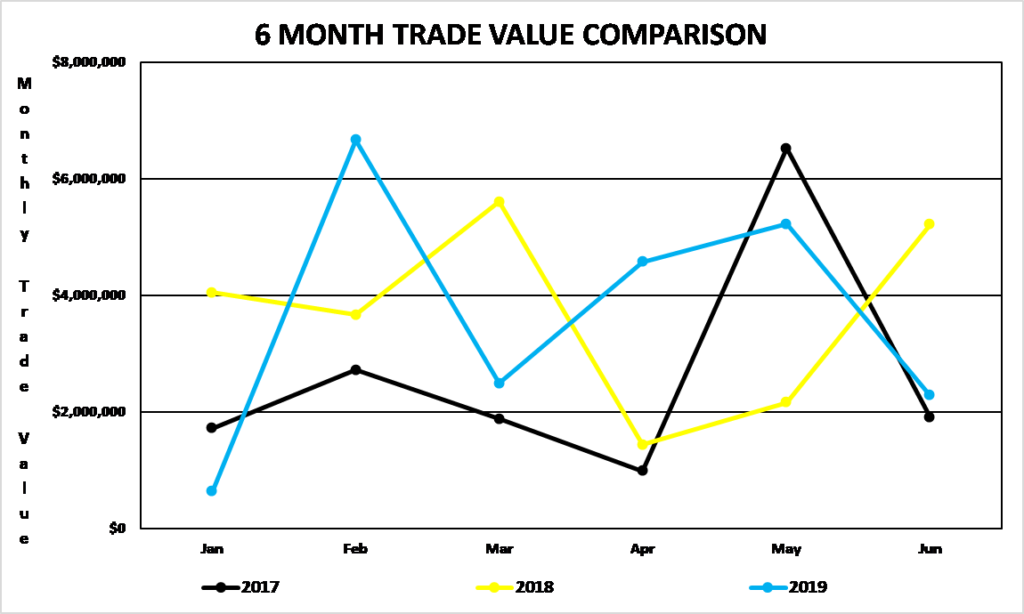
TRADING VOLUMES AND VALUES
Trading volume for the six-month period January 2, 2019 to June 28, 2019 was 4,456,110 shares for a value of $21,868,819.00. Trading volume for the six-month period January 2, 2018 to June 29, 2018 was 3,868,181 shares for a value of $22,133,799.25.
Trading volume for the three-month period April 1, 2019 to June 28, 2019 was 2,183,140 shares for a value of $ 12,080,550.63. Trading volume for the three-month period April 1, 2018 to June 29, 2018 was 1,217,120 shares for a value of $ 8,810,107.76.
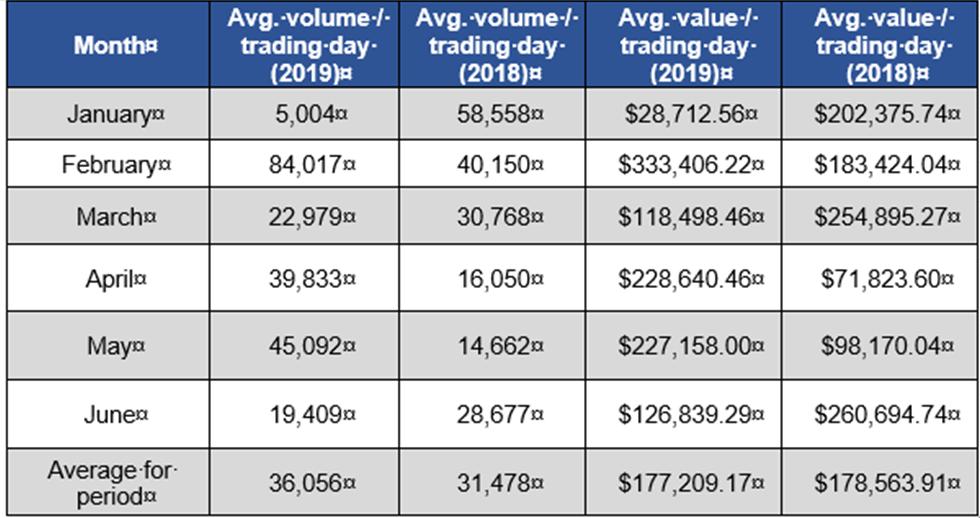
AVERAGE DAILY VOLUME AND VALUE
For the six-month period from January 2, 2019 to June 28, 2019, the average volume per trading day was 36,056 shares for a value of $177,209.17. By comparison, for the six-month period from January 2, 2018 to June 28, 2018, the average volume per trading day was 31,478 shares for an average value of $ 178,563.91.
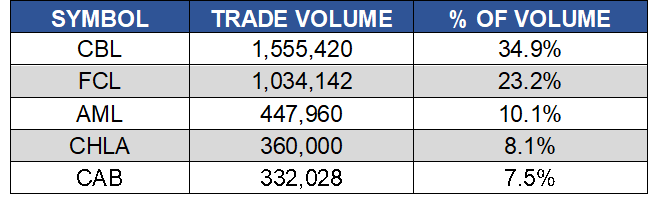
SHARE VOLUME AND VALUE LEADERS (SIX MONTH PERIOD)
The top five share volume leaders on BISX for the six-month period January 2, 2019 to June 28, 2019 with their contribution to total traded volume displayed as a percentage were:
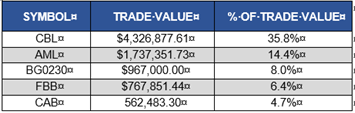
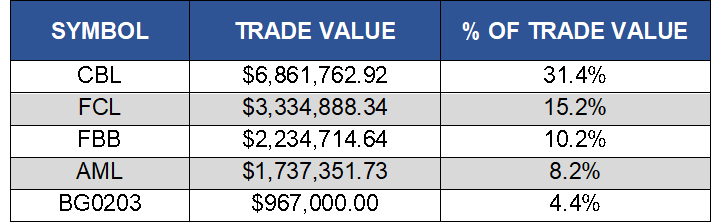
The top five share value leaders on BISX for the six-month period January 2, 2019 to June 28, 2019 with their contribution to total traded value displayed as a percentage were:
SHARE VOLUME AND VALUE LEADERS (THREE MONTH PERIOD)
The top five share volume leaders on BISX for the three-month period April 1, 2019 to June 28, 2019 with their contribution to total traded volume displayed as a percentage were:

The top five share value leaders on BISX for the three-month period April 1, 2019 to June 28, 2019 with their contribution to total traded value displayed as a percentage were: